ProductsEngineering IntelligenceCode Flow Health
You can feel the delivery slipping, but not where.
Code Flow Health is Regentis’s adaptive analytics framework: it models your real delivery flow end to end and pinpoints the stage that’s actually holding you back. What lands is one answer — the bottleneck stage, its trend, and the drill-down behind it.
The same day, run twice.
Here is next Tuesday — once as it goes today, once with Code Flow Health switched on.
“Why is this taking so long?” lands in your DMs before standup. You open the delivery dashboard; cycle time looks normal, and all you have is a feeling.
COSTS · three dashboards, no answerThe overview already shows it: this sprint’s constraint is review — flagged, scored, trend attached.
INSTEAD · constraint named, evidence attachedYou pull two senior engineers off feature work to reconstruct the sprint — exporting PRs into a spreadsheet, annotating by hand.
COSTS · two engineers, half a dayYou open the stage drill-down instead: which items waited, where the time went, what changed since last sprint. Nobody gets pulled off work.
INSTEAD · drill-down open, nobody interruptedEnd of day, the answer is still “it depends.” You promise leadership a report by Friday and take the spreadsheet home.
COSTS · the evening, and FridayThe reply to leadership is already written: the constraining stage, its trend, and what the team is trying next.
INSTEAD · the answer, sent before dinnerLeadership asked the same question — you finally had the answer.
It models your delivery flow, then points at the constraint.
- The trigger — it watches delivery as it happens.Regentis reads commits, pull requests, builds, and deployments from your connected SCM and CI/CD — continuously, per team.
- The work — it learns each team’s flow, not a template.The adaptive model maps the real stages — coding, review, integration, deployment — scores them 0–100 across Velocity, Quality, Collaboration, and Efficiency, and locates the constraining stage. It deliberately doesn’t prescribe a workflow: a team with no PR review isn’t penalized if velocity and quality hold.
- The artifact — the bottleneck lands with evidence attached.You get the constraint stage, its tier (Emerging → Healthy → Top Tier → Elite) and trend, and the drill-down behind it — refreshed as the flow changes.
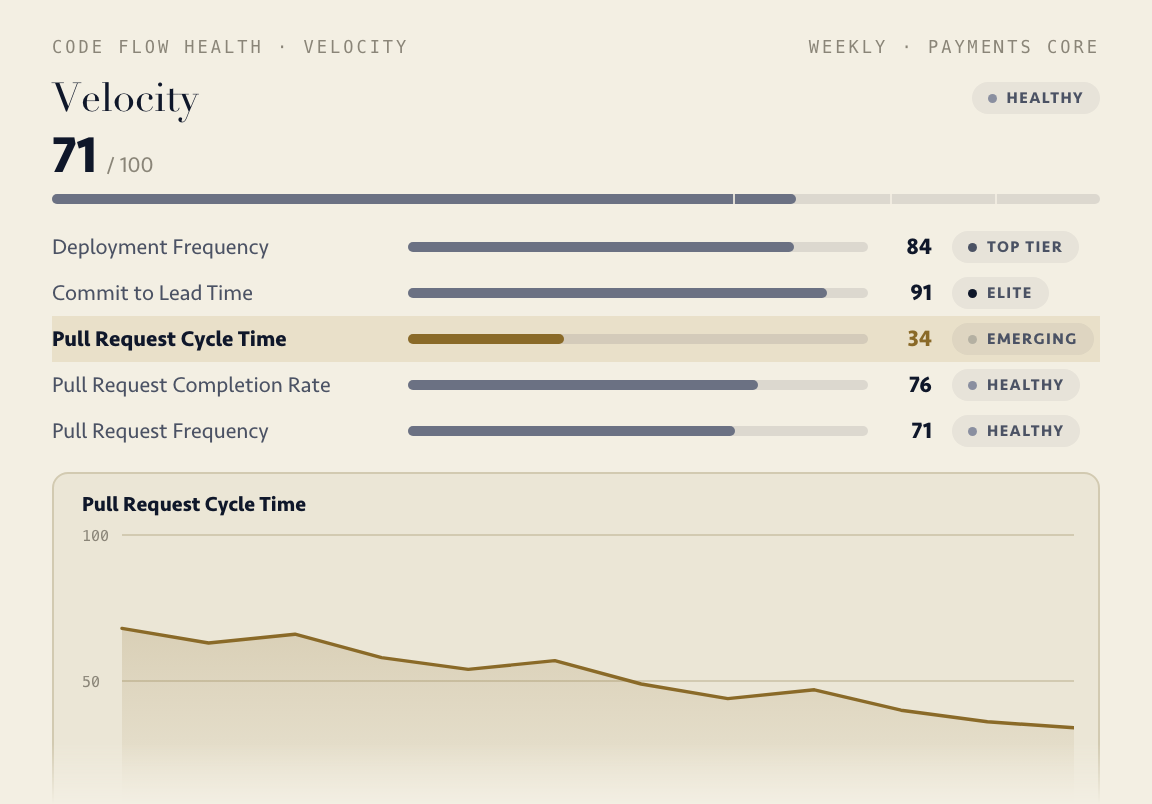
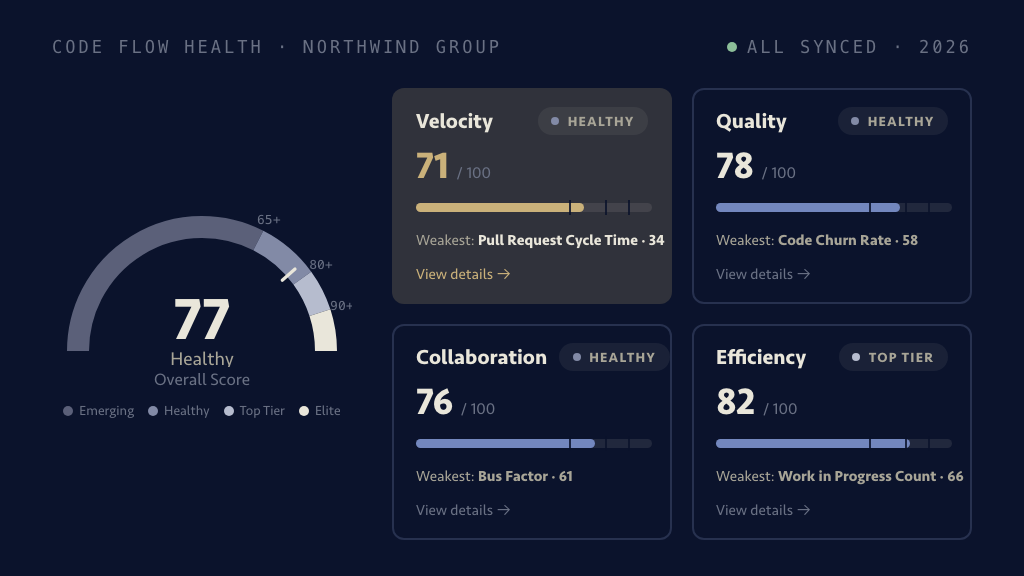
One score, one drill-down — both inspectable.
Your team’s score across Velocity, Quality, Collaboration, and Efficiency, its tier from Emerging to Elite, and the flagged constraint stage — refreshed continuously, not on a reporting cycle.
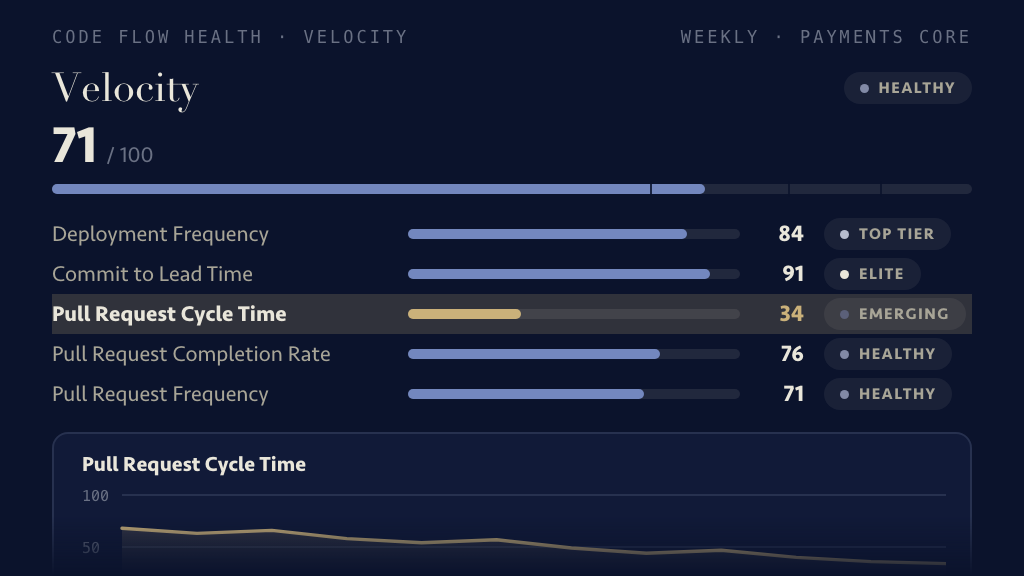
The evidence behind the flag: which items waited, where the time went, and what changed since the last period — the thing you open when someone asks “prove it.”
Fair questions, answered plainly.
What is Code Flow Health, exactly, and how is it scored? +
It’s Regentis’s own adaptive analytics framework — not a borrowed standard. Each team’s delivery flow is scored 0–100 across four sub-categories — Velocity, Quality, Collaboration, and Efficiency — which roll into four tiers: Emerging, Healthy, Top Tier, and Elite. The model adapts to how each team actually works and continuously flags the stage constraining delivery.
Is this just another way to score individual developers? +
Fair suspicion — this category has earned it. Code Flow Health measures system and team health only: no leaderboards, no per-person scores, ever. That’s a stated policy across all of Regentis, not a toggle an admin can flip.
We already track DORA. What does this add? +
Keep DORA — Regentis computes it too, and the two are complementary. DORA tells you the outcomes: how often you ship and how fast you recover. Code Flow Health models the flow between those outcomes and points at the stage causing them — which is the part you can actually act on.
Our teams all work differently — won’t a benchmark punish that? +
Fixed industry benchmarks do, which is why the model isn’t one. Code Flow Health learns each team’s real flow and scores against it; a team that skips PR review isn’t penalized if its velocity and quality hold. If you want a framework that enforces one prescribed way of working, this is deliberately not that tool.
Next Tuesday, the question has an answer.
Connect your SCM and CI/CD and the model starts reading your flow immediately — the first constraint read lands within the trial week.