ProductsFinancial Intelligence

Pillar 03 · Explain

Engineering spend, finally explained.

What is Financial Intelligence?

Financial Intelligence is Regentis’s answer to engineering’s least-explained line item. It classifies every work item into one of five investment categories — Innovation, KTLO, Productivity, Improvement, and Other — estimating effort from the commits, pull requests, and tickets already linked to it. Cost, share, and effort roll up by team, group, and org with period-over-period trends and a written summary each period. Engineers never log an hour.

Inside Financial Intelligence

Explain every engineering dollar without timesheets.

Feature 01 · Investment AllocationFLAGSHIP

Stop bending Jira into an allocation tracker.

  • ProblemCustom fields decay. Timesheets lie. Allocation tracking rots within a quarter.
  • HowThe engine classifies effort straight from commits, PRs, and tickets.
  • ResultAn always-current allocation picture by category, team, and period.
Explore Investment Allocation
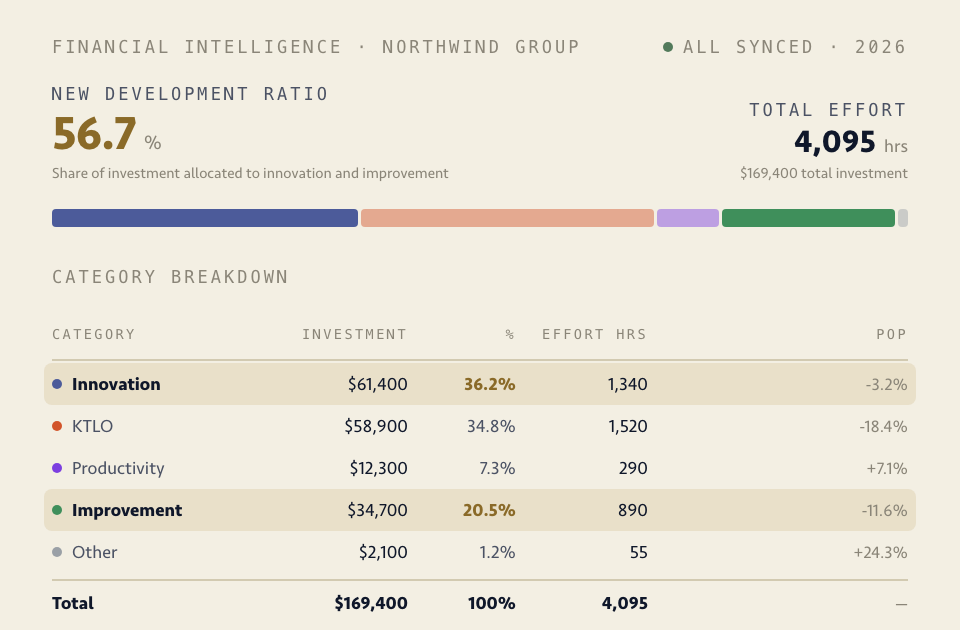
Investment allocation across the five categories — Innovation, KTLO, Productivity, Improvement, Other — each with its cost, its share, and its effort hours, totalling $169,400 and 4,095 hours; the New Development Ratio of 56.7% above is the Innovation and Improvement shares added together, and no one logged a timesheet to produce any of it
Feature 02 · Financial Snapshot

Every period, someone rebuilds the spend story by hand.

  • ProblemSpreadsheets get rebuilt each period, and nobody can check the split.
  • HowThe same engine that classified the work writes the period up.
  • ResultA dated summary whose every number traces to the rows beneath it.
Explore Financial Snapshot
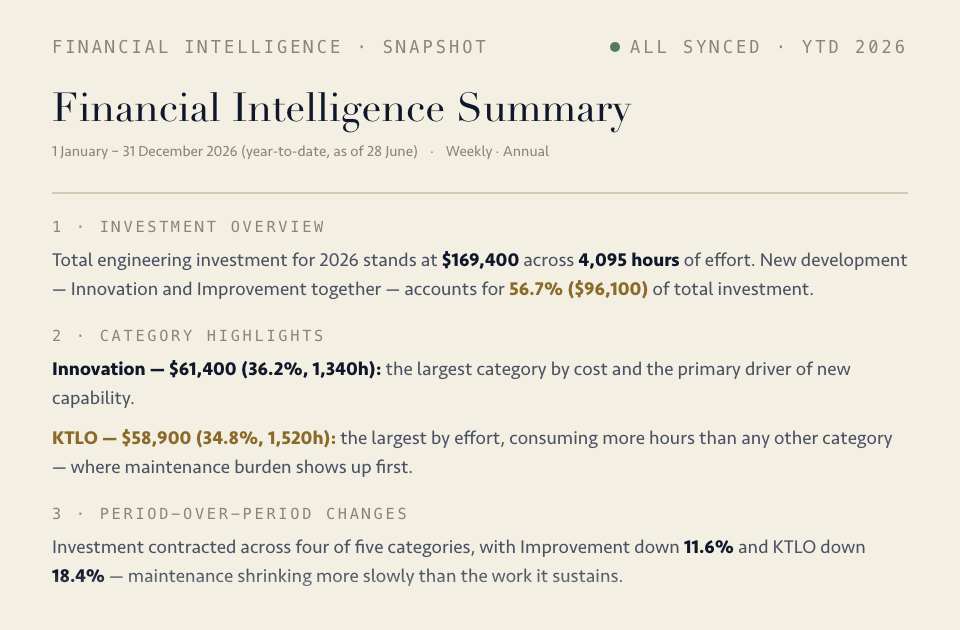
The Financial Intelligence Summary, written by the product: $169,400 of engineering investment across 4,095 hours year-to-date, with new development at 56.7%, Innovation the largest category by cost and KTLO the largest by effort — a board-ready summary dated to the actuals it was built from, not reconstructed at quarter end
Feature 03 · Investment Trends

Last quarter’s split and this one’s were counted differently.

  • ProblemNumbers counted differently each period can’t be compared, only argued about.
  • HowOne derivation, every period, at whatever scope you select.
  • ResultPeriods you can set side by side, in cost or in share.
Explore Investment Trends
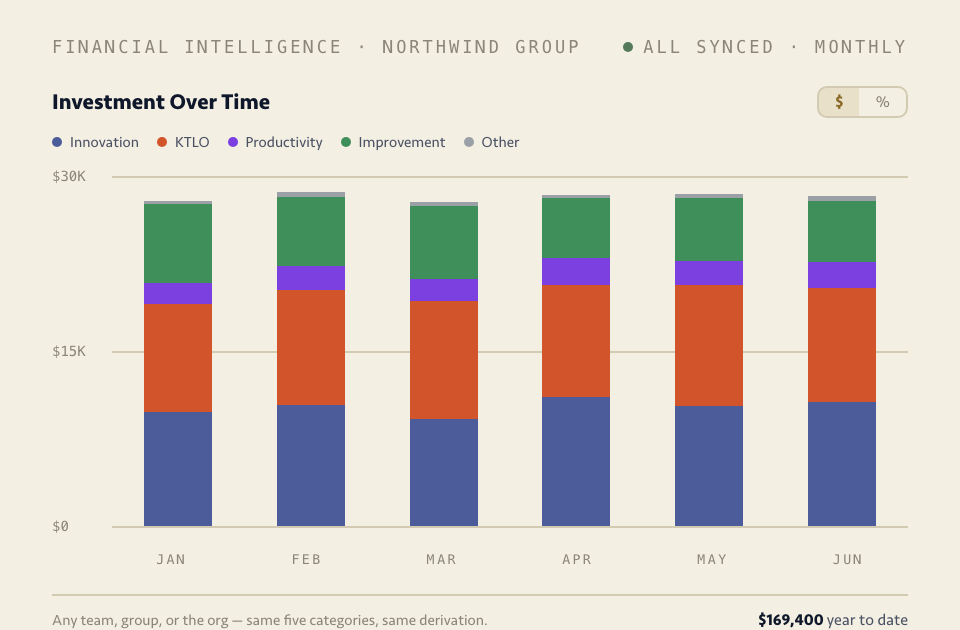
Investment Over Time: the five categories stacked across six months, every period counted the same way and readable as cost or as share — six bars summing to the same $169,400 the category breakdown reports
The stance

Zero burden on engineers.

No work logging, no mandatory fields, no ritual — the numbers come from the system, so the team never pays a tax for finance’s clarity.

Lights out

Budget season, without the archaeology.

A week after connecting the stack, allocation is a live view instead of a quarter-end scramble — and nobody logged a single hour.