ProductsEngineering Intelligence

Pillar 01 · Measure

Find the stage that’s holding delivery back.

What is Engineering Intelligence?

Engineering Intelligence is Regentis’s measurement layer for engineering organizations. It connects to code, pipelines, and tickets and models how each team actually delivers — through Code Flow Health, always-on DevEx surveys, and continuously computed DORA metrics. Instead of a wall of charts, leaders get the one stage holding delivery back, with evidence attached — measuring the system, never the individual.

Inside Engineering Intelligence

Understand how your teams really deliver.

Feature 01 · Code Flow HealthFLAGSHIP

You can feel the delivery slipping, but not where.

  • ProblemCycle time averages look fine while one stage quietly absorbs days.
  • HowAn adaptive model learns each team’s flow and locates the constraint.
  • ResultThe bottleneck stage, its trend, and the drill-down behind it.
Explore Code Flow Health
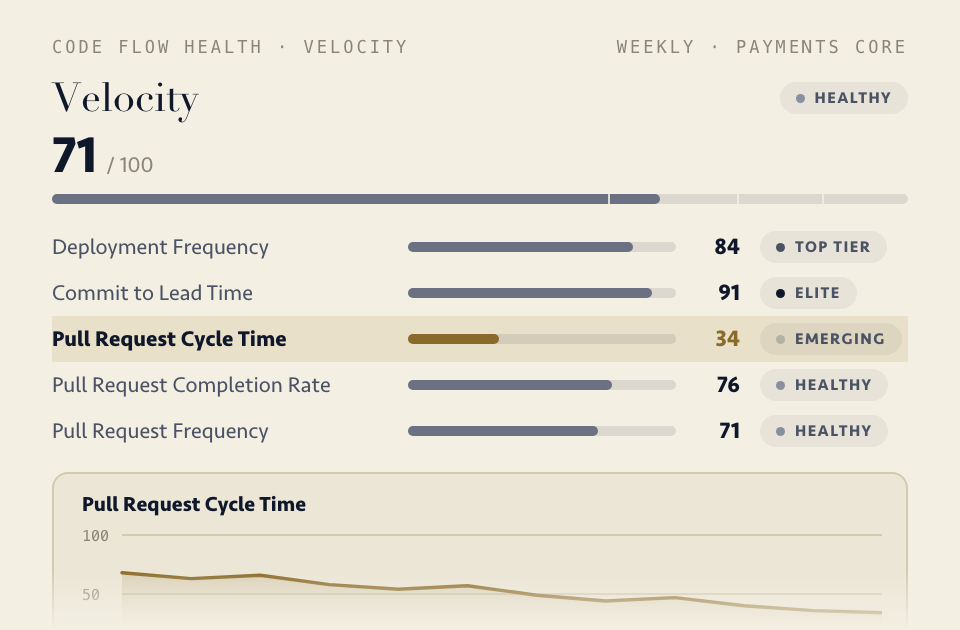
Code Flow Health drill-down: the Velocity dimension scores 71 of 100, with every delivery metric scored and tiered on one panel — Pull Request Cycle Time flagged as the constraint at 34 while Commit to Lead Time sits at Elite — and its trend chart below showing the score falling out of Healthy over twelve weeks
Feature 02 · Always-on DevEx

A DevEx survey only works if people actually answer.

  • ProblemQuarterly surveys die of fatigue — response rates too thin to steer with.
  • HowLightweight pulses in the flow of work, routed visibly into action.
  • ResultParticipation, sentiment by category, and trends that survive a leadership review.
Explore Always-on DevEx
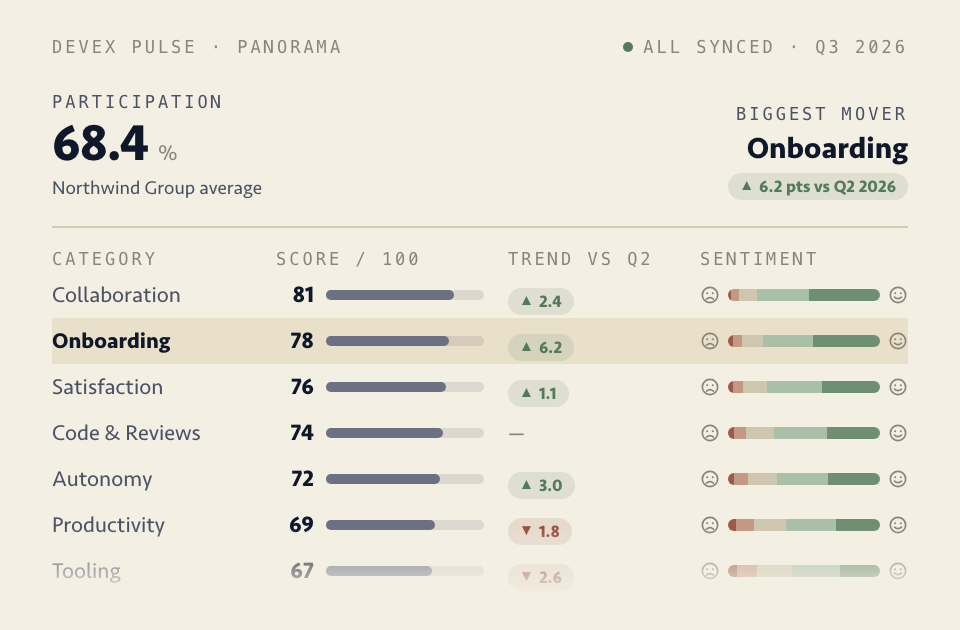
DevEx Panorama: participation running at 68.4% across the group, Onboarding flagged as the biggest mover at 6.2 points up on last quarter, and every DevEx category scored 0–100 with its own movement and its sentiment spread beside it
Feature 03 · DORA Metrics

Your DORA numbers are only as good as the data behind them.

  • ProblemHand-rolled DORA goes stale on arrival, and nobody trusts the chart.
  • HowThe four keys computed continuously from pipeline and incident data.
  • ResultDefensible, comparable DORA by team — QBR-ready without the data scramble.
Explore DORA Metrics
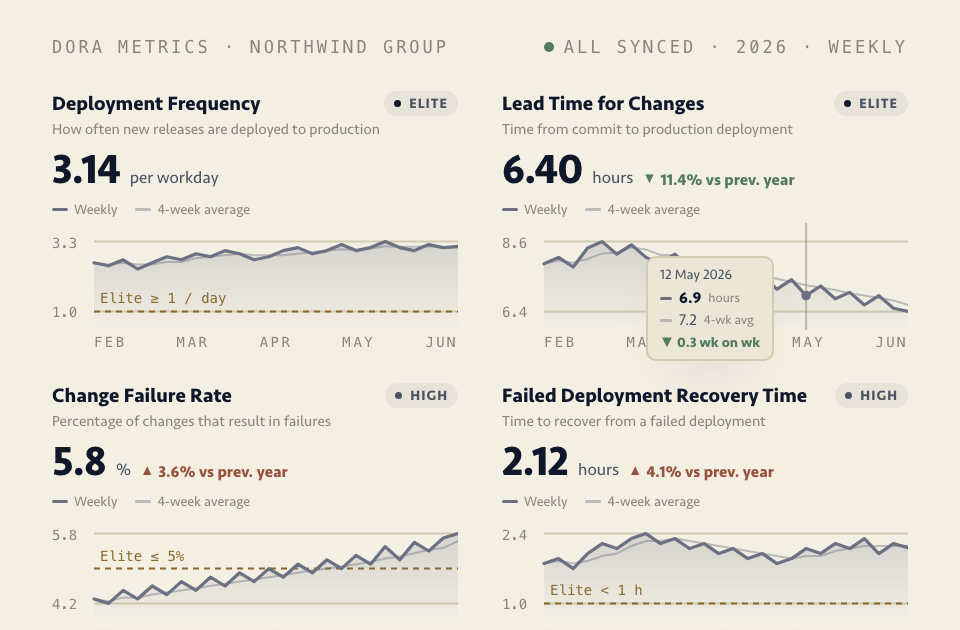
DORA dashboard: all four keys on one screen — deployment frequency at 3.14 per workday and lead time at 6.40 hours both Elite, change failure rate at 5.8% and recovery time at 2.12 hours both High — each printing the definition it is measured by, each scored against a published threshold, and each carrying its weekly series over a 4-week average
The stance

System and team health. Never the individual.

No leaderboards, no per-person scores — Regentis measures the system so the team can fix the system.

Lights out

Find the constraint. Fix it. Watch it move.

A week after connecting GitHub and Jira, you know which stage costs you the most days — and you have the evidence to fix it.