ProductsFinancial IntelligenceInvestment Allocation
Stop bending Jira into an allocation tracker.
Regentis’s classification engine categorizes investment allocation straight from the work — your team never logs an hour. What lands is an always-current picture of where engineering capacity goes, by category, team, and period, with the period’s summary already written.
The same day, run twice.
Here is the Tuesday finance asks where the quarter went — once as it goes today, once with the classification engine on.
Finance asks where engineering capacity went last quarter. The Jira “investment type” field is blank on half the tickets and gamed on the rest.
COSTS · a field nobody fillsThe allocation view is already current — every task classified into the five investment categories, with the effort estimated from the work itself.
INSTEAD · classified, current, no ritualYou ask team leads to “clean up their tickets by Friday.” They backfill a quarter from memory and resent every minute of it.
COSTS · engineers taxed, data inventedNobody is asked anything. The engine reads the work that actually happened, and the picture updates as the work does.
INSTEAD · derived, not self-reportedThe spreadsheet ships with categories you privately know are fiction — and next quarter, the ritual starts over.
COSTS · a report nobody believesThe breakdown by category, team, and period is ready to send — with the period’s summary already written on top.
INSTEAD · sent with the story writtenCustom fields decay. Timesheets lie. — The work doesn’t.
It classifies the work you already did.
- The trigger — it reads real activity, continuously.The engine reads commits, pull requests, and tickets from your connected stack as the work happens — there is no logging step anywhere in the flow.
- The work — it classifies effort into your categories.Every task item is classified into one of five investment categories — Innovation, KTLO, Productivity, Improvement, Other — with an effort estimate grounded in the data linked to it across your tools; continuously, without a single manual entry. Engineers never see a form; zero burden is the design, not a promise.
- The artifact — an always-current allocation picture lands.Where capacity went, by category, team, and period — with the period’s summary written from the same numbers, so the picture arrives already explained.
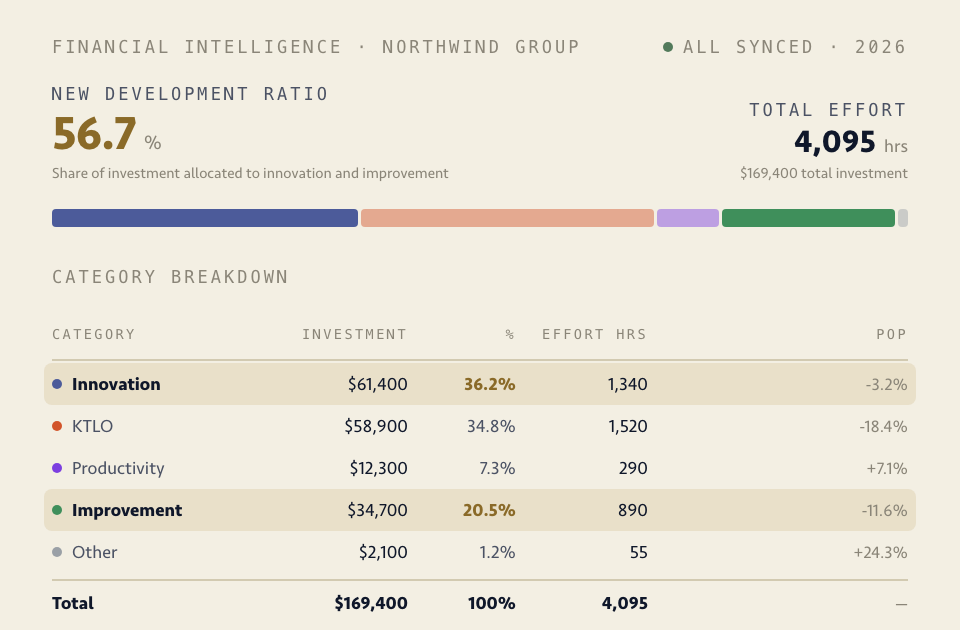
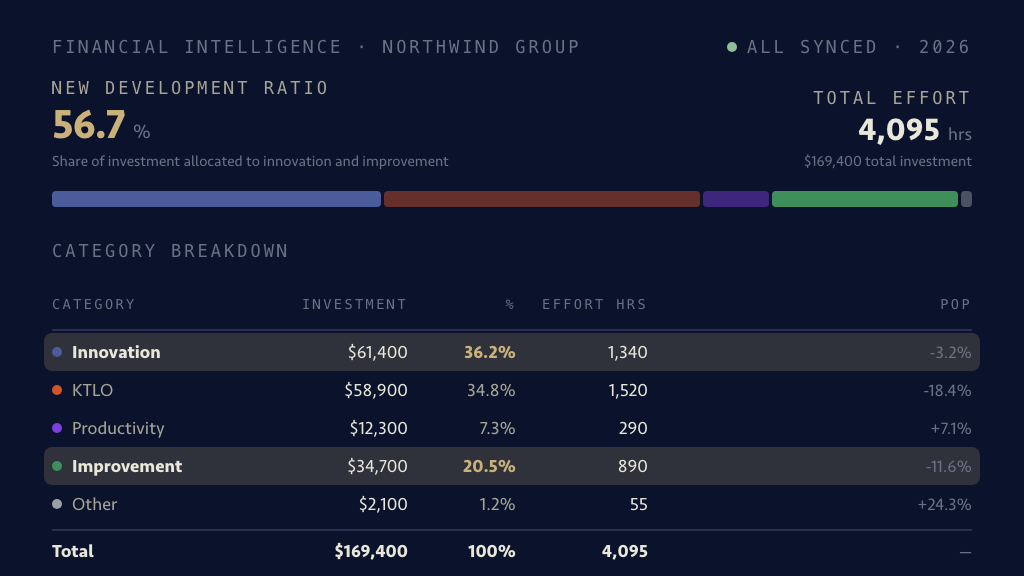
The allocation picture, and the work behind it.
Investment across Innovation, KTLO, Productivity, Improvement, and Other — cost and share per category, by team and period, current as of the last commit rather than the last ritual.
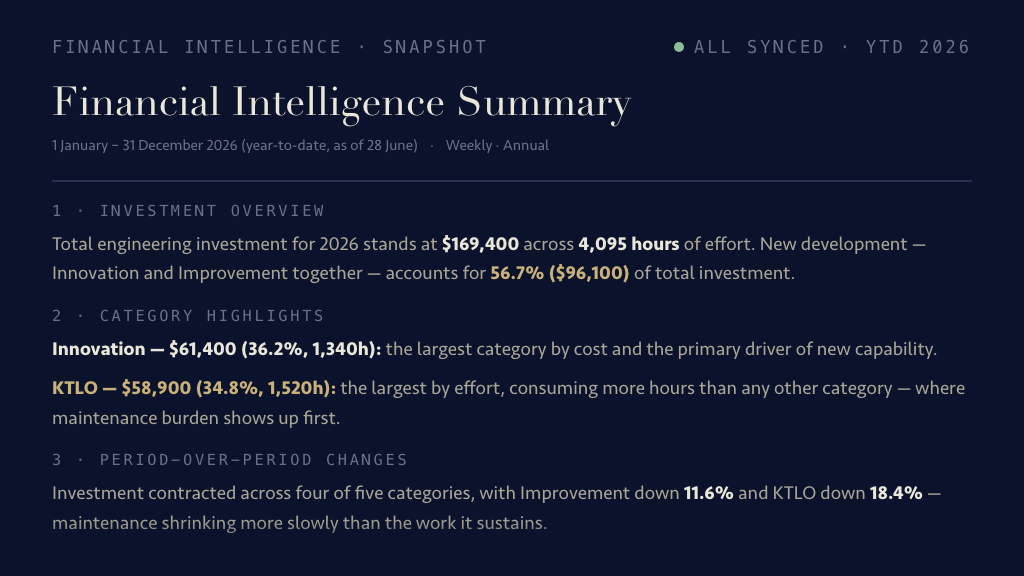
The read of the period the platform writes itself — total investment and effort, the new-development share, and the per-category highlights, dated to the actuals it was built from — the thing you open when someone asks “what’s the story?”
Fair questions, answered plainly.
What are the five investment categories? +
Innovation, KTLO (keep the lights on), Productivity, Improvement, and Other. Every task item is classified into one of them, with an effort estimate grounded in the data linked to it across your tools, and rollups show cost and share per category over time — by team, group, and org. The categories are the same everywhere, which is what makes the numbers comparable.
How accurate can classification be if nobody labels anything? +
It’s an estimation engine, and it’s honest about that — but consider the baseline it replaces: fields half-filled, categories gamed, timesheets backfilled from memory. Classification derived from what actually happened, on one consistent method, is both more complete and more consistent — one method, every task item, every period. And the period’s summary states the read in plain language, so the numbers arrive already explained.
Will engineers have to change how they work — new fields, tags, branch-naming rules? +
No — that tax is precisely the thing being retired. Allocation fields bolted onto the tracker go unfilled under deadline, drift into whatever gets scrutinized least, and breed resentment that poisons the data; derived allocation doesn’t depend on anyone maintaining the ritual. No logging, no mandatory fields, no naming conventions — zero burden on engineers is the pillar’s stated stance, not a configuration.
Is this tracking individual engineers’ time? +
No. Allocation describes where team capacity went, by category — it is not per-person utilization, and Regentis’s platform-wide policy is no individual scoring, ever. Tools in this category die the day engineers conclude they’re being clocked; this one is deliberately built so there’s nothing to clock.
Next quarter, nobody backfills anything.
Connect your SCM and tracker and the first classified allocation picture assembles within the trial — no field, no form, no hour logged.