ProductsFinancial IntelligenceFinancial Snapshot
Every period, someone rebuilds the spend story by hand.
The period written up for you: what engineering spend went where, what moved against last period, and what that suggests — assembled from the same classified activity behind the allocation numbers, and stamped with the date of the actuals it used. The write-up is ready before anyone asks for it.
The same day, run twice.
Here is the Tuesday the spend question lands — once as it goes today, once with the period already written up.
The CFO asks where engineering money went last period. Someone opens a spreadsheet and starts reconstructing it from ticket exports and memory.
COSTS · a week, every periodThe write-up is already there: total investment, total hours, and the split across the five categories — dated to the actuals it used.
INSTEAD · already writtenThe split is a judgment call made under deadline — “roughly half is new development, I think.” Nobody in the room can check it.
COSTS · a number nobody can checkNew development is the Innovation and Improvement shares added together, so anyone can check the headline by adding the rows beneath it.
INSTEAD · a number that checks outThe deck ships late with the engineering line softened by a footnote. Next period: the same reconstruction.
COSTS · the deadline, and the doubtThe next period is already writing itself, from work that was happening anyway. Nobody logged an hour to produce it.
INSTEAD · no logging, no reconstructionThe question still came — the reconstruction didn’t.
From classified activity to a written period, with no one assembling it.
- The trigger — it starts from the same classified activity.The allocation engine’s output — effort derived from commits, pull requests, and tickets across the integrated tools — is the input. Nothing new is collected, and nobody is asked to log anything.
- The work — it writes the period up.Investment and effort roll up across Innovation, KTLO, Productivity, Improvement, and Other; each category’s share and its movement against the prior period are computed; and the summary says which categories moved, by how much, and what that suggests. The judgment calls stay yours — Regentis supplies the derivation.
- The artifact — a dated financial summary.An overview, the per-category highlights, the period-over-period movements, and a closing recommendation — stamped with the date of the actuals behind it, so how current it is sits on its face. Ready whenever you open it, mid-period included.
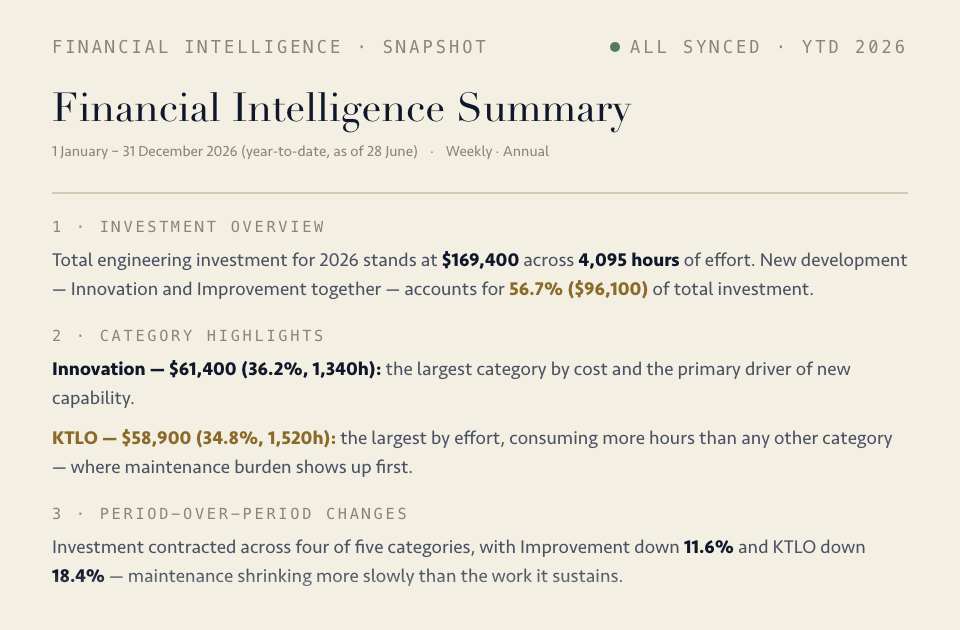
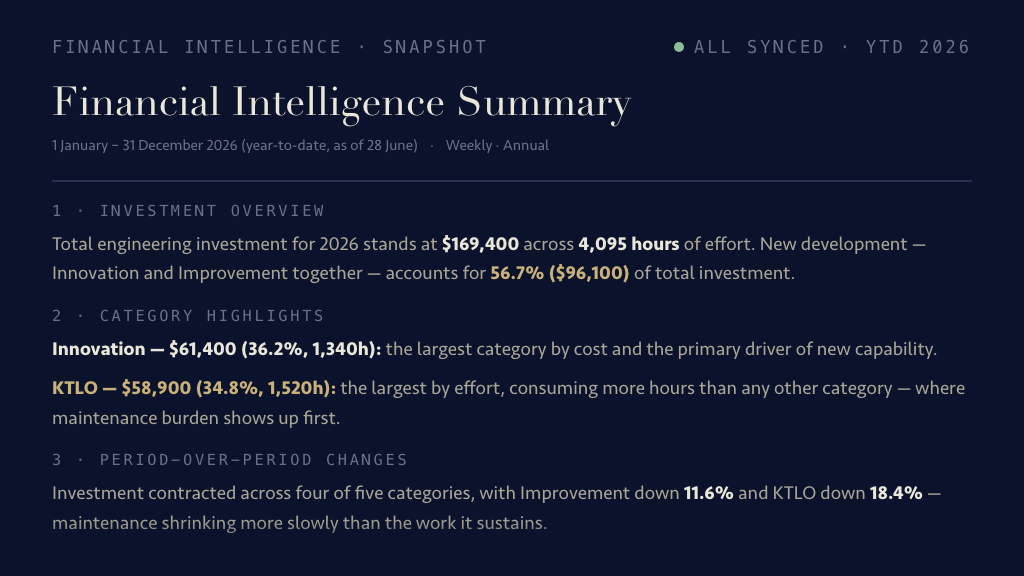
The spend story, already written.
The overview, the category highlights, what moved against the prior period and what it suggests — assembled from classified activity and stamped with the date of the actuals behind it.
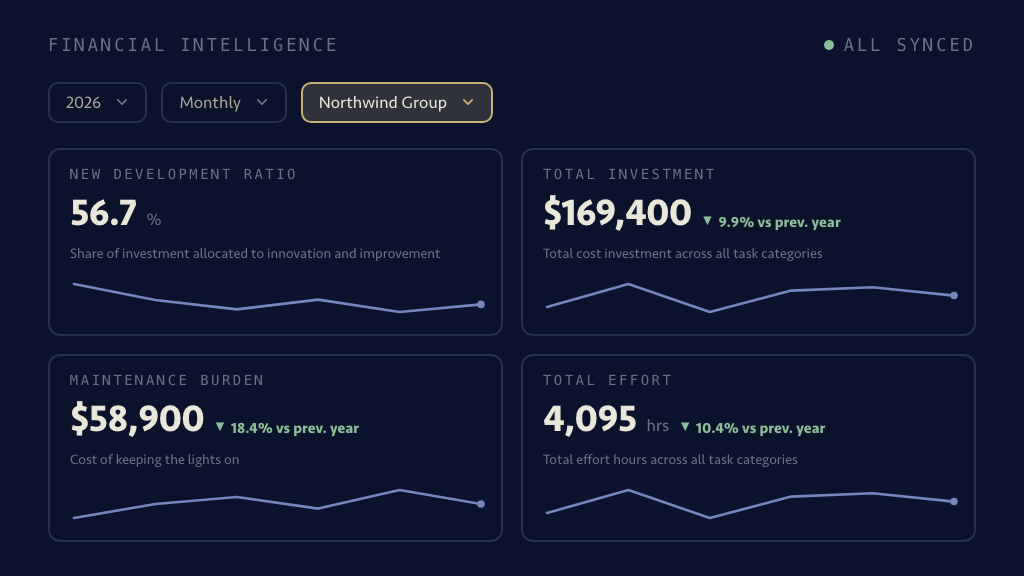
New development ratio, total investment, maintenance burden, and total effort — for whatever team and period the controls are set to, every one of them derived from the same classified activity.
Fair questions, answered plainly.
Will our auditors accept numbers derived this way? +
That’s your auditors’ call, and no tool should promise otherwise — what Regentis changes is what you can show them. Instead of a deadline spreadsheet whose splits are judgment calls, every number is derived from the work itself on one documented method, applied the same way every period. Defensibility here means a consistent, documented derivation, not a black box asking to be trusted.
How can you cost engineering time without anyone logging it? +
Effort is estimated from the work itself. Every task carries linked entities across the integrated tools — the commits, pull requests, reviews, and tickets attached to it — and the estimate is derived from those, then priced. It is a derivation, not a self-report, which is the point: a timesheet records what someone remembered to type, and this records what actually happened.
Does finance have to ask engineering to run reports? +
No — the snapshot is a view, not a favor. Anyone with workspace access opens it and exports the board view in one click; the quarter-end data-pull request to engineering simply stops existing. Mid-quarter questions get answered the same way, because the view is continuous rather than assembled per close.
We only close quarterly — isn’t continuous overkill? +
The close stays quarterly; what changes is what the close costs. When the snapshot assembles continuously, quarter-end becomes a read instead of a project — and the mid-quarter “roughly where are we?” question, which today goes unanswered, gets the same one-click answer.
Make the spend question a read, not a project.
Connect the stack and the period writes itself from your engineering activity — ready before anyone asks.