ProductsEngineering IntelligenceDORA Metrics
Your DORA numbers are only as good as the data behind them.
Deployment frequency, lead time, change failure rate, and recovery time — computed straight from your delivery, accurate and always current. The artifact is a DORA view by team and org, with trends, ready without a data pull.
The same day, run twice.
Here is the Tuesday before the QBR — once as it goes today, once with DORA wired to your pipeline.
QBR is Thursday and the DORA slide still shows last quarter. Someone has to re-pull deploys, incidents, and lead times by hand — that someone is you.
COSTS · a day of archaeologyThe four keys are already current — computed from the pipeline overnight, on the same definitions as last quarter.
INSTEAD · current numbers, zero pullsTwo teams turn out to count “a deployment” differently. The chart says one thing, and the room already knows not to trust it.
COSTS · the chart’s credibilityEvery team is measured on one shared definition, so the comparison is the conversation — not the dispute.
INSTEAD · one definition, comparable teamsYou ship the deck with a caveat slide explaining the data. Nobody will remember the number; everyone will remember the caveat.
COSTS · the evening, and trustThe QBR view exports as it stands: four keys, trends, by team — and the same numbers will still be there next week.
INSTEAD · defensible, repeatable, doneHand-rolled DORA goes stale on arrival — wired-in DORA doesn’t.
Wired to your pipeline, not assembled for a slide.
- The trigger — it reads the source of truth.Regentis ingests pipeline runs, deployments, and incident data from your connected CI/CD and delivery tools — continuously, not at reporting time.
- The work — it computes the four keys, one definition everywhere.Deployment frequency, lead time for changes, change failure rate, and time to restore are computed on the same definitions for every team, refreshed as delivery happens. No team-by-team interpretation, no spreadsheet step in the middle.
- The artifact — a current DORA view, comparable across teams.The four keys by team and org with trends over time — ready for the QBR, the board pack, or the Tuesday question, without a data-pull scramble.
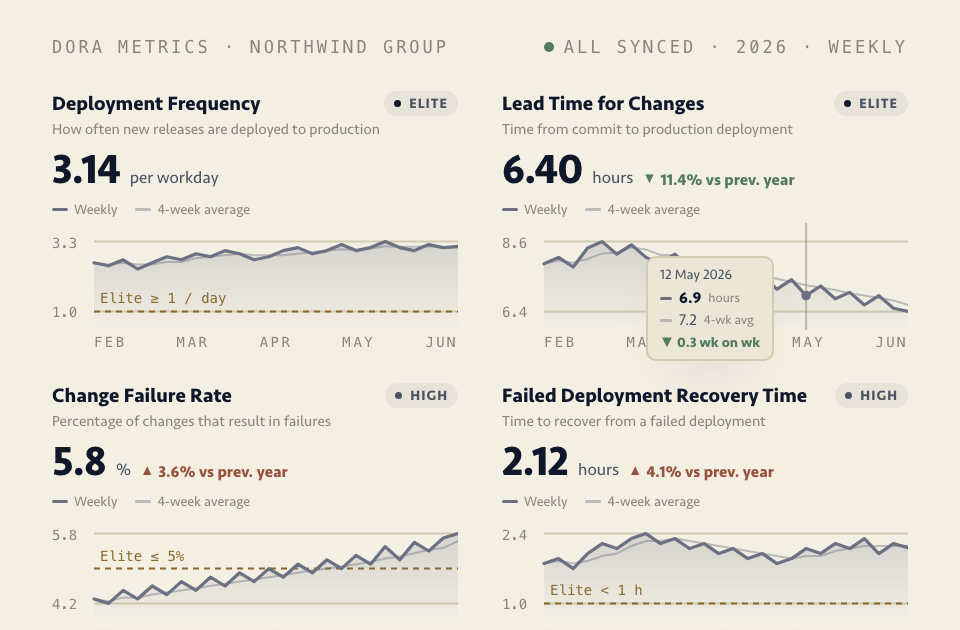
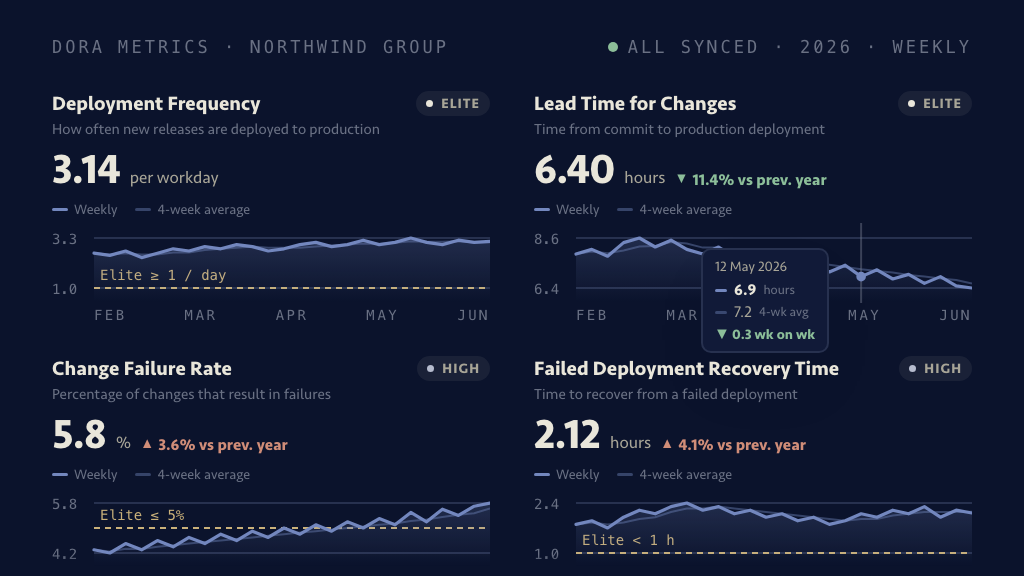
Numbers you can defend in the QBR.
All four keys for a team with their trends — current as of the last pipeline run, not the last time someone had a free afternoon.
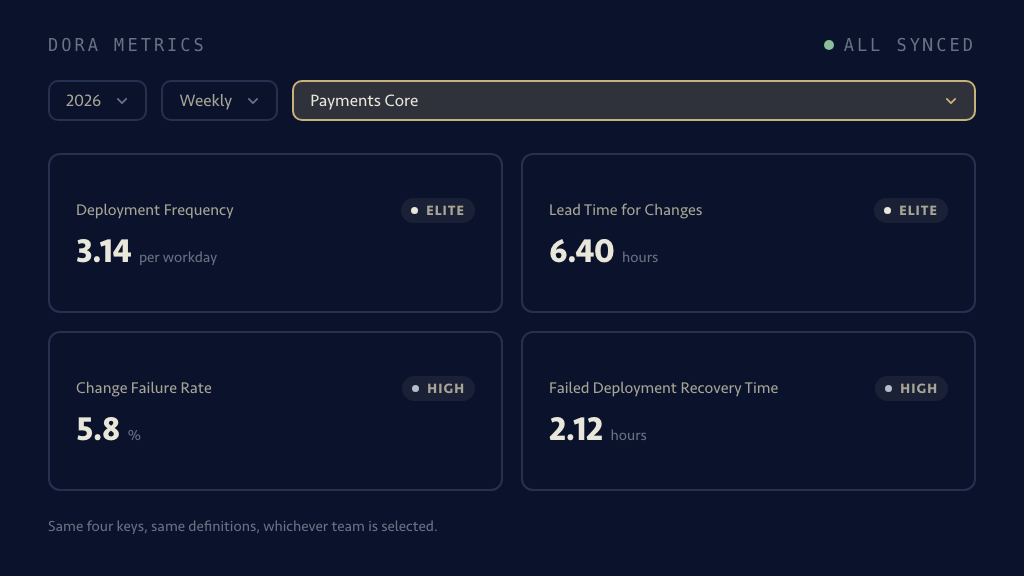
The four keys for any team in the org, read from the same scope tree on definitions that never flex — switch the team, never the yardstick.
Fair questions, answered plainly.
We already track DORA in a spreadsheet. Why change? +
The spreadsheet works — right up until the numbers need to be current and comparable. Hand-rolled DORA goes stale the day after it’s assembled, and definitions quietly drift between teams until nobody trusts the chart. Wiring the four keys to the pipeline removes the assembly step and the drift at the same time.
Are DORA metrics still enough when AI writes most of the code? +
On their own, no — four outcome metrics can’t tell you why delivery changed, only that it did. That’s why DORA is one lens in Engineering Intelligence rather than the whole product: Code Flow Health models the flow behind the outcomes and points at the constraining stage. The four keys stay valuable as the defensible, industry-standard outcome measures — they’re just not the diagnosis.
Will this be used to score individual developers? +
No. DORA in Regentis is computed at team and org level, and Regentis’s platform-wide policy is no individual scoring — no leaderboards, no per-person metrics, ever. Delivery metrics attached to people get gamed and breed distrust; attached to systems, they get fixed.
Our incident data is messy — can the failure and recovery keys be trusted? +
Honest constraint: change failure rate and time to restore are only as good as the incident signal behind them, which is why Regentis computes them from your connected incident and pipeline data on one consistent method rather than from self-reported postmortems. If your incident tooling isn’t connected yet, start with deployment frequency and lead time — the two keys your pipeline alone can ground — and add the rest when the data is.
Retire the spreadsheet before the next QBR.
Connect your pipeline and incident tools and the four keys start computing immediately — current from the first day of the trial.